Social Media Agency Report 2026

We analysed the public profiles and websites of 1,185 social media agencies in 21 countries: how many publish prices, which services and platforms they offer, where they are based and how old they are. Every figure below shows its sample size.

Data collected November 9, 2026

Headline findings

  1. 7.5%of agencies link to a pricing page from their homepage (n = 1,133); only 6.3% show a price on it. Most agencies do not show prices up front on a dedicated page.
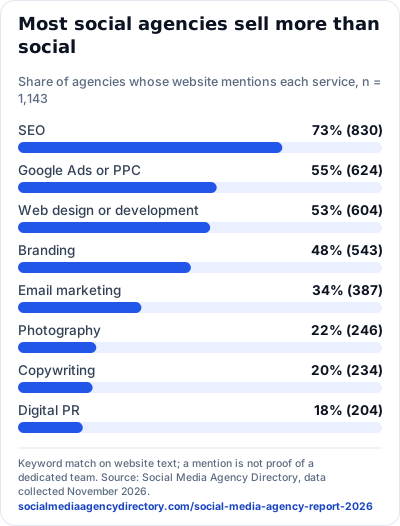
  2. 73%of agencies (n = 1,143) also mention SEO on their website, and 53% mention web design or development. The typical "social media agency" is a full-service digital shop.
  3. 84%of the 1,185 agencies are in four countries: United States (45%), United Kingdom, Canada and Australia.
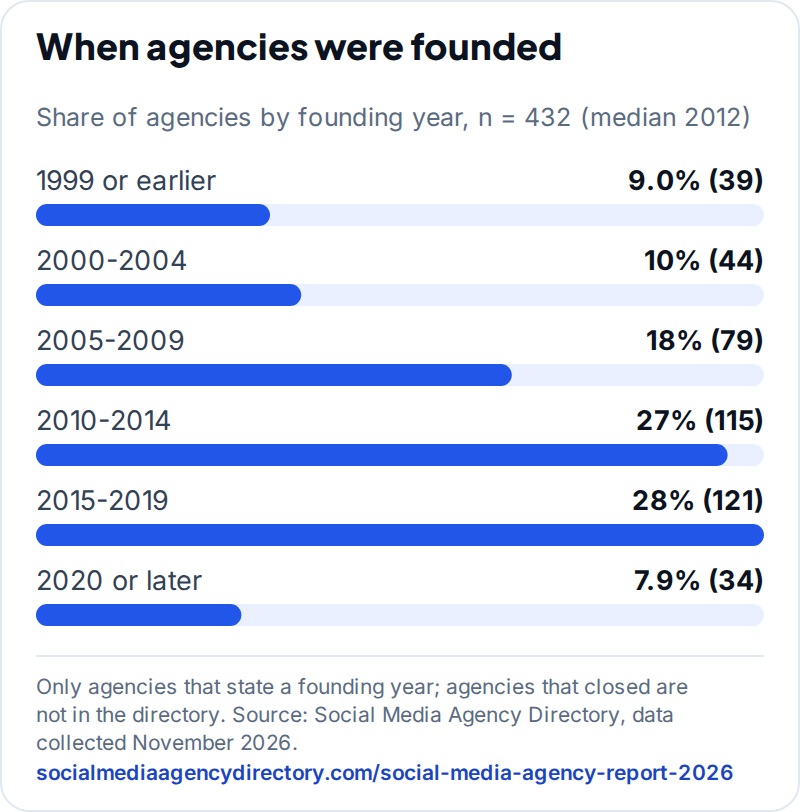
  4. 2012is the median founding year (n = 432 agencies that state one). 36% were founded in 2015 or later.
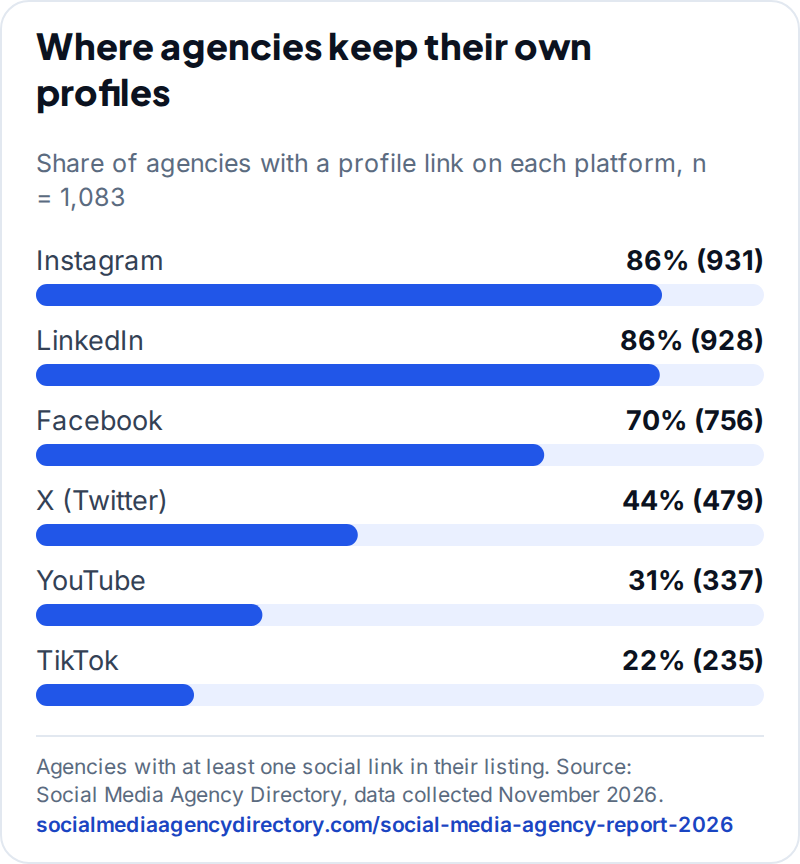
  5. 86%of agencies (n = 1,083) link an Instagram profile, 86% LinkedIn and 70% Facebook; TikTok only 22%.

Methodology

Sample. All 1,185 agencies that were live in the Social Media Agency Directory on November 9, 2026 (active listings of type "social media agency", 21 countries). The directory is curated by a person on our team from agencies' own public websites; it is not a census of the industry and it skews to English-speaking markets. See how we verify agencies.

Sources. (1) The directory database: country and city, service tags, social links, founding year and platform fields. (2) Text extracted from each agency's own website during our verification crawl (services and industries named, founding year). (3) A new price-transparency check run on November 9, 2026: we fetched the homepage of each agency's website once (1,133 of 1,185 loaded), looked for a link labelled Pricing, Prices, Plans, Packages or Rates, and fetched that page once to see whether it contains a currency amount.

Sample sizes. The base differs by question because not every agency publishes every fact. The n is printed on every chart. Anything with fewer than 20 agencies is mentioned in a footnote and never charted.

Currencies. The report does not compare price levels, so nothing is converted between currencies. We tested automatic extraction of "from $X per month" figures from agency websites; a hand check of the first agencies showed it picked up case-study revenue figures, add-on fees and prices for other services, so we do not publish price levels.

Limitations.

  • A pricing link is a lower bound for "publishes prices": some agencies show prices without a dedicated page or label the page differently (for example "Investment"). Pages built with JavaScript may hide amounts from our check, and the amount check cannot tell whose price it is (it is not limited to social media services).
  • Services, industries and founding years come from keyword matches on agency websites. A mention is not proof of a dedicated team or an exclusive focus.
  • The directory lists agencies that are operating today, so founding years describe survivors, and only 36% of agencies state a founding year.
  • The country mix reflects how the directory was built, not the true geography of the industry.
  • One snapshot, November 9, 2026. Counts will change as agencies are added or removed.

Pricing: most agencies do not publish it

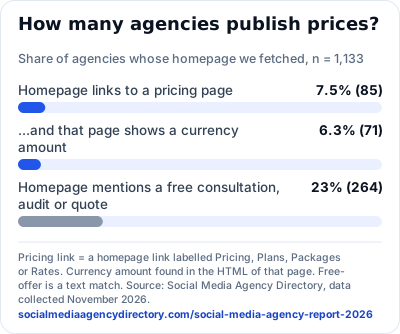
Of the 1,133 agency homepages we could load, 85 (7.5%) link to a page called Pricing, Plans, Packages or Rates, and on 71 (6.3%) that page contains at least one currency amount. Separately, 23% (264) mention a free consultation, audit or quote on their homepage, which is an invitation to a sales conversation rather than a price. The two groups overlap.

How many agencies publish prices?Bar chart: 7.5% of 1133 agencies link to a pricing page, 6.3% show a price on it, 23% mention a free consultation, audit or quote. How many agencies publish prices? Share of agencies whose homepage we fetched, n = 1,133 Homepage links to a pricing page 7.5% (85) ...and that page shows a currency amount 6.3% (71) Homepage mentions a free consultation, audit or quote 23% (264) Pricing link = a homepage link labelled Pricing, Plans, Packages or Rates. Currency amount found in the HTML of that page. Free- offer is a text match. Source: Social Media Agency Directory, data collected November 2026. socialmediaagencydirectory.com/social-media-agency-report-2026

Roughly 92 in 100 agencies do not link a pricing page from their homepage.

PNGSVG

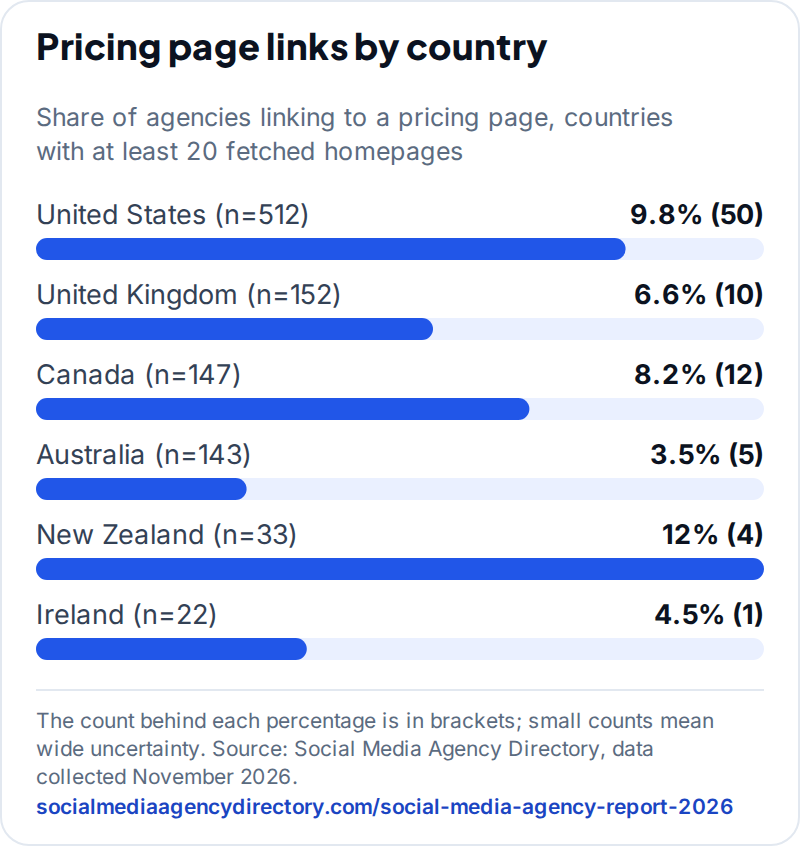
Among countries with at least 20 loaded homepages the share runs from 3.5% in Australia (5 of 143) to 12% in New Zealand (4 of 33). With counts this small, treat country differences as indicative.

Pricing page links by countryBar chart of the share of agencies linking to a pricing page by country: United States 9.8%; United Kingdom 6.6%; Canada 8.2%; Australia 3.5%; New Zealand 12%; Ireland 4.5% Pricing page links by country Share of agencies linking to a pricing page, countries with at least 20 fetched homepages United States (n=512) 9.8% (50) United Kingdom (n=152) 6.6% (10) Canada (n=147) 8.2% (12) Australia (n=143) 3.5% (5) New Zealand (n=33) 12% (4) Ireland (n=22) 4.5% (1) The count behind each percentage is in brackets; small counts mean wide uncertainty. Source: Social Media Agency Directory, data collected November 2026. socialmediaagencydirectory.com/social-media-agency-report-2026

The counts behind each share are small (1 to 50 agencies), so the gaps between countries could be chance.

PNGSVG

Footnote: 12 agencies have a minimum-budget band on their directory profile (n < 20), too few to publish. See our pricing guide for benchmark ranges from market surveys.

Services: social is the entry point, not the whole offer

Of the 1,093 agencies with service tags, 57% are tagged with social media management, 37% with paid social advertising and 16% with influencer marketing.

Which services do agencies offer?Bar chart of service tags: SEO & Content Marketing 79%; Analytics & Reporting 63%; Content Creation 58%; Social Media Management 57%; Paid Social Advertising 37%; Ecommerce Social 32%; Video & Short-Form 19%; Influencer Marketing 16% Which services do agencies offer? Share of agencies tagged with each service, n = 1,093 SEO & Content Marketing 79% (862) Analytics & Reporting 63% (687) Content Creation 58% (629) Social Media Management 57% (621) Paid Social Advertising 37% (401) Ecommerce Social 32% (354) Video & Short-Form 19% (204) Influencer Marketing 16% (174) Tags come from services named on each agency website. Source: Social Media Agency Directory, data collected November 2026. socialmediaagencydirectory.com/social-media-agency-report-2026

Analytics and reporting, content creation and SEO are tagged more often than paid social or influencer work.

PNGSVG

Beyond social, 73% of the 1,143 agencies whose website lists services mention SEO, and 53% mention web design or development.

Most social agencies sell more than socialBar chart of non-social services mentioned: SEO 73%; Google Ads or PPC 55%; Web design or development 53%; Branding 48%; Email marketing 34%; Photography 22%; Copywriting 20%; Digital PR 18% Most social agencies sell more than social Share of agencies whose website mentions each service, n = 1,143 SEO 73% (830) Google Ads or PPC 55% (624) Web design or development 53% (604) Branding 48% (543) Email marketing 34% (387) Photography 22% (246) Copywriting 20% (234) Digital PR 18% (204) Keyword match on website text; a mention is not proof of a dedicated team. Source: Social Media Agency Directory, data collected November 2026. socialmediaagencydirectory.com/social-media-agency-report-2026

If you are shortlisting for social only, expect most agencies to pitch bundles.

PNGSVG

Platforms: where agencies show up themselves

Among the 1,083 agencies with at least one social link, 86% link Instagram, 86% LinkedIn and 70% Facebook, 31% YouTube and 22% TikTok. This is where agencies keep their own presence, which is not the same as the platforms they manage for clients.

Where agencies keep their own profilesBar chart of agency social profiles by platform: Instagram 86%; LinkedIn 86%; Facebook 70%; X (Twitter) 44%; YouTube 31%; TikTok 22% Where agencies keep their own profiles Share of agencies with a profile link on each platform, n = 1,083 Instagram 86% (931) LinkedIn 86% (928) Facebook 70% (756) X (Twitter) 44% (479) YouTube 31% (337) TikTok 22% (235) Agencies with at least one social link in their listing. Source: Social Media Agency Directory, data collected November 2026. socialmediaagencydirectory.com/social-media-agency-report-2026

Instagram and LinkedIn are level, Facebook trails, and TikTok is the least common of the major platforms.

PNGSVG

For the platforms agencies say they work on we only have data for 111 of 1,185 agencies, so read this chart as indicative.

Platforms agencies say they work onBar chart of platforms served: Facebook 56%; LinkedIn 43%; Instagram 32%; TikTok 24% Platforms agencies say they work on Share of the 111 agencies with platform data (small sample) Facebook 56% (62) LinkedIn 43% (48) Instagram 32% (35) TikTok 24% (27) Only 111 of 1,185 agencies have this field; read as indicative. Source: Social Media Agency Directory, data collected November 2026. socialmediaagencydirectory.com/social-media-agency-report-2026

Small sample (n = 111): use as a rough guide only.

PNGSVG

Industries named on agency websites

1,050 agencies name at least one industry. 35% mention B2B and 14% mention B2C. The industry ranking below leaves those two audience tags out.

Industries agencies name on their sitesBar chart of industries: E-commerce 53%; Technology 46%; Healthcare 30%; Retail 30%; Nonprofit / NGO 29%; Food and restaurants 25%; Education 25%; Legal 22%; Real estate 21%; Travel 21% Industries agencies name on their sites Share of agencies naming each industry, n = 1,050 E-commerce 53% (554) Technology 46% (481) Healthcare 30% (318) Retail 30% (315) Nonprofit / NGO 29% (304) Food and restaurants 25% (263) Education 25% (261) Legal 22% (227) Real estate 21% (223) Travel 21% (216) Naming an industry is not an exclusive focus. Source: Social Media Agency Directory, data collected November 2026. socialmediaagencydirectory.com/social-media-agency-report-2026

E-commerce and technology are named most often. Naming an industry is a marketing claim, not a measure of client mix.

PNGSVG

Where agencies are based

The 1,185 agencies are spread over 21 countries. United States 534, United Kingdom 159, Canada 153 and Australia 152 account for 84% of the total.

Where the agencies are basedBar chart of agencies per country: United States 534; United Kingdom 159; Canada 153; Australia 152; New Zealand 34; Ireland 24; Germany 18; France 18 Where the agencies are based Agencies per country, n = 1,185 listings in 21 countries United States 45% (534) United Kingdom 13% (159) Canada 13% (153) Australia 13% (152) New Zealand 2.9% (34) Ireland 2.0% (24) Germany 1.5% (18) France 1.5% (18) 13 other countries 7.8% (93) Directory coverage, not a census of the industry; it skews to English-speaking markets. Source: Social Media Agency Directory, data collected November 2026. socialmediaagencydirectory.com/social-media-agency-report-2026

The directory is strongest in English-speaking markets. It is a directory sample, not an industry census.

PNGSVG

1,131 listings carry a city, across 106 different cities. Sydney has the most agencies (48). 54 listings are country-level only.

Top cities by number of agenciesBar chart of top cities: Sydney 48; London 45; Toronto 34; Austin 34; Manchester 32; Chicago 30; Atlanta 30; Melbourne 29; New York 28; Vancouver 28; Phoenix 26; Miami 25 Top cities by number of agencies Agencies per city, n = 1,131 listings with a city Sydney 48 London 45 Toronto 34 Austin 34 Manchester 32 Chicago 30 Atlanta 30 Melbourne 29 New York 28 Vancouver 28 Phoenix 26 Miami 25 54 listings are country-level only and are not counted here. Source: Social Media Agency Directory, data collected November 2026. socialmediaagencydirectory.com/social-media-agency-report-2026

Sydney leads; the top 12 cities hold 34% of agencies with a city.

PNGSVG

Agency age

432 agencies state when they were founded. The median is 2012, so the typical agency is about 14 years old; the middle half were founded between 2007 and 2016. 36% were founded in 2015 or later and 38% before 2010.

When agencies were foundedBar chart of founding year cohorts: 1999 or earlier 9.0%; 2000-2004 10%; 2005-2009 18%; 2010-2014 27%; 2015-2019 28%; 2020 or later 7.9% When agencies were founded Share of agencies by founding year, n = 432 (median 2012) 1999 or earlier 9.0% (39) 2000-2004 10% (44) 2005-2009 18% (79) 2010-2014 27% (115) 2015-2019 28% (121) 2020 or later 7.9% (34) Only agencies that state a founding year; agencies that closed are not in the directory. Source: Social Media Agency Directory, data collected November 2026. socialmediaagencydirectory.com/social-media-agency-report-2026

62% of agencies that state a founding year were founded in 2010 or later. Closed agencies are not in the directory, so this describes survivors.

PNGSVG

Freelancers and team size

Not charted because the samples are too small: 9 of 1,185 listings (0.8%) are flagged as freelancers, and only 13 agencies have a team-size band on their profile. The directory is built to list agencies, so the freelancer share says nothing about the wider market.

How to cite and use this data

The figures and charts are published under a Creative Commons Attribution 4.0 (CC BY 4.0) licence: you are free to quote the figures and reuse the charts, including commercially, as long as you credit Social Media Agency Directory with a link back to this page. Each chart has a PNG and an SVG download. All figures are also available as one JSON file and as CSV tables: countries, top cities, service categories, other services, own social profiles, industries, founding years, pricing transparency, pricing links by country (notes). The tables are aggregates of the November 9, 2026 snapshot; the directory has grown since, so live counts elsewhere on the site are higher.

Suggested citation

Social Media Agency Directory (2026). Social Media Agency Report 2026: pricing, services and platforms from 1,185 agencies. Retrieved November 9, 2026, from https://socialmediaagencydirectory.com/social-media-agency-report-2026

Attribution line for images

Source: Social Media Agency Directory, Social Media Agency Report 2026

Please state the sample size when you quote a figure and keep the date: this is one snapshot taken on November 9, 2026. Questions or corrections: [email protected].

Looking for an agency?

Compare 1,185 agencies by city and service, or tell us what you need and we will suggest a shortlist.

Get matched Browse all agencies